From this post, you will learn how to use Glue to read the schema from the S3 file using its crawlers and build a common metadata store to other AWS services like Hive, Presto and Redshift Spectrum.
Before Glue Data Catalog (GDC) feature, it is painful to create schemas for the same file as the schema definitions vary from Hive and Redshift. Creating multiple schemas for the same file structure not only challenges the data integrity but also involves a lot of manual work. Most of us are already familiar with Glue as ETL framework on AWS. But its cataloging features will quickly add value to the business as well as help to streamline the technical workflows.
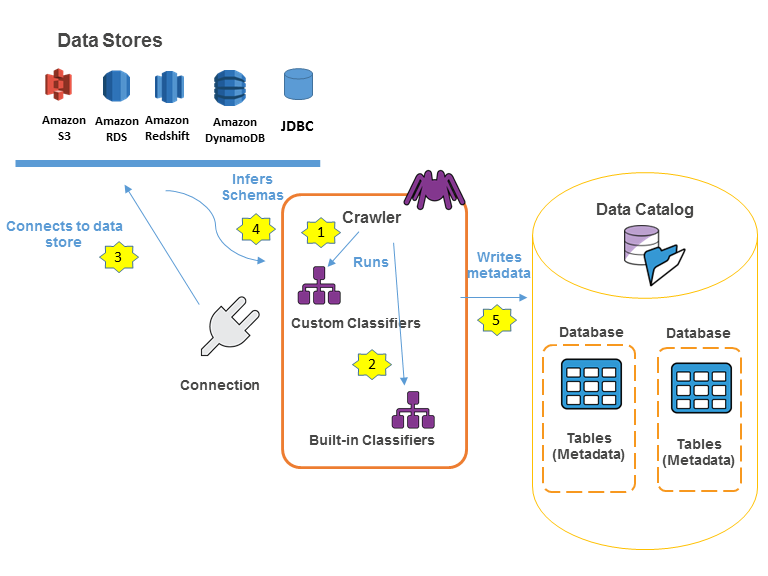 |
| Populating Glue Data Catalog (Source: AWS documentation https://docs.aws.amazon.com/glue/latest/dg/populate-data-catalog.html) |
In AWS, no matter what kind of data we deal with, S3 will be the primary ingestion/landing zone for our ETL processing. The Glue crawlers will read data from S3 and build a data catalog, and we can use the same data catalog as our hive meta-store which will be integrated with Presto as well.
Here are the steps:
- Drop the dataset on S3 or assume data is already there on S3.
- Setup a Glue Crawler to read data from the file on S3.

Once the glue crawler is run, we must be able to see the glue database/catalog getting created. We can get the schema definition, by accessing the tables under that glue catalog.
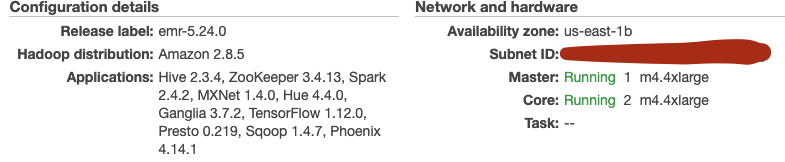
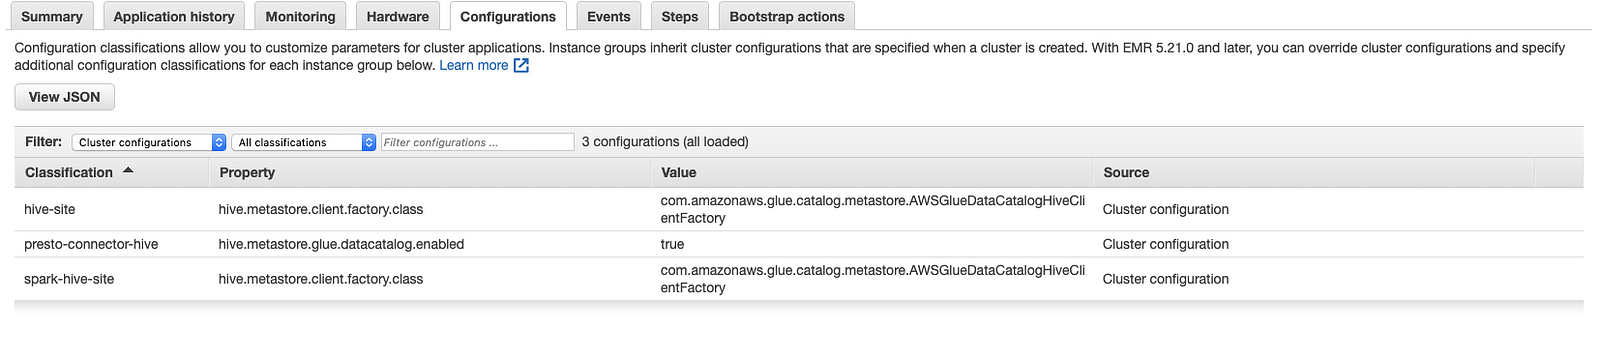
- Now its time to spin up your EMR cluster and make sure these configuration settings are set for the cluster: set up hive-site to use glue data catalog meta-store, enable presto-connector-hive and spark-hive-site as well.
Note:
~ If you are unable to use the Master public DNS to do SSH, please try SSH with the private IP address. (Get the IP address of the master node by going to Hardware tab -> Master Instance Details -> there you will find your EC2 instance ID along with status, public DNS name, private DNS name, public IP address, and private IP address).
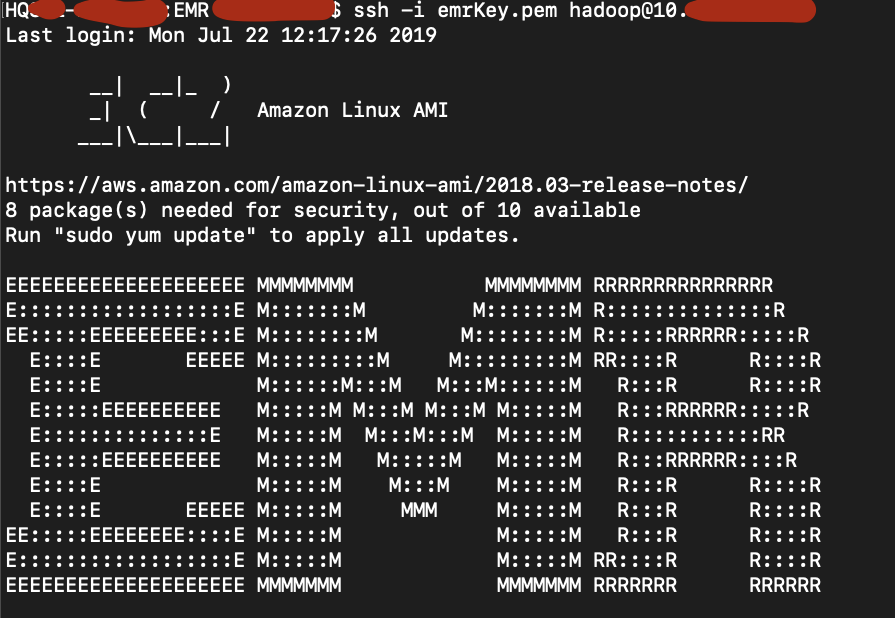
~ Download the private key file (.pem) to launch the cluster. Then, use: ssh -i <name of your .pem file>.pem hadoop@<DNS Name/IP Address)
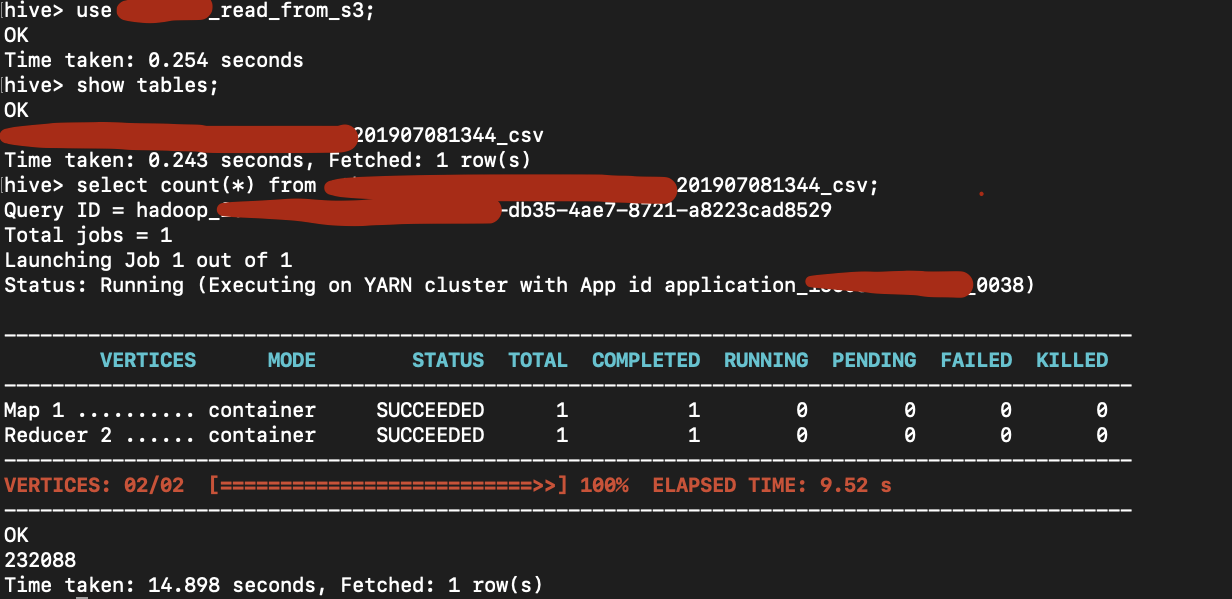
- Access HIVE on the EMR cluster, we must be able to see the glue databases here and access the tables on glue as hive tables.
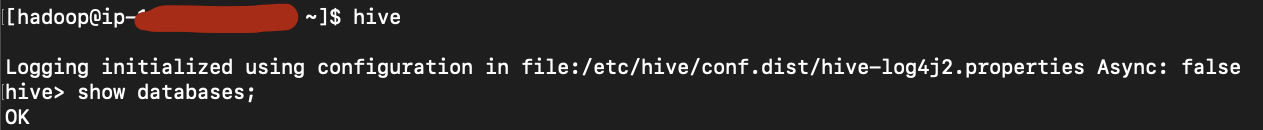
Now, we must be able to see the Glue Data Catalog Database as one of the Hive Databases. Use that database, to run all your queries.
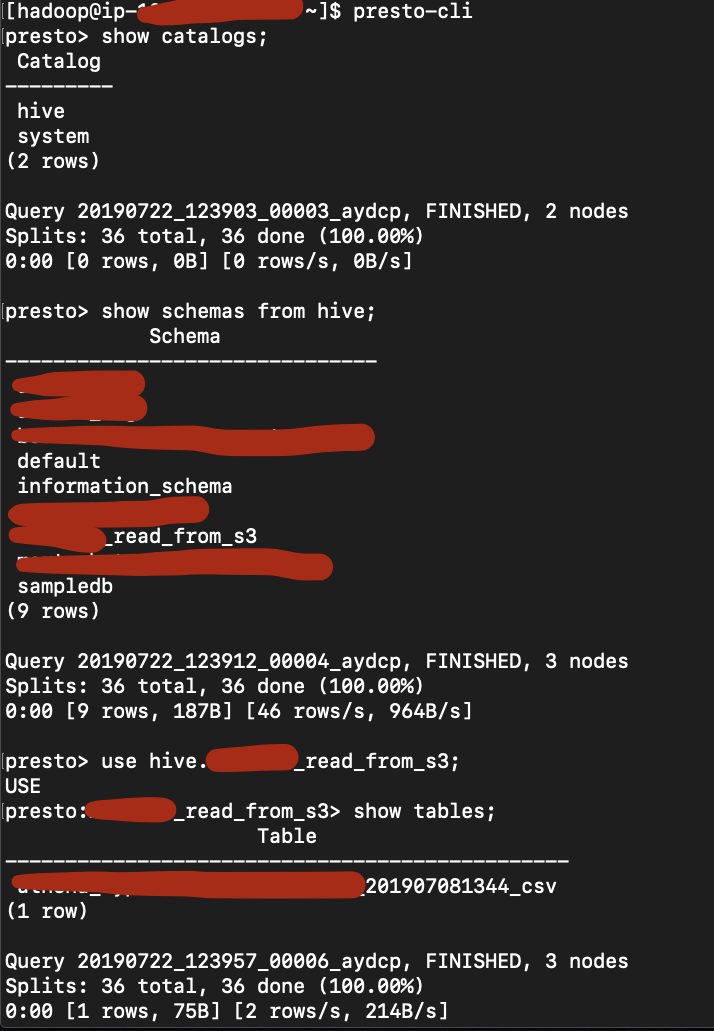
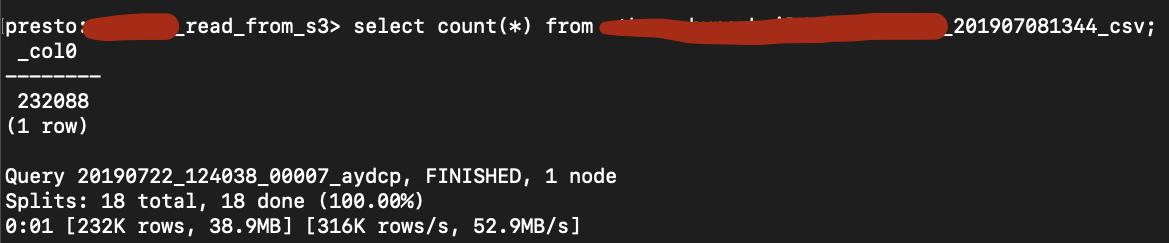
- Access PRESTO-CLI on EMR, and we can use glue catalogs as our catalog and start querying the dataset on S3 directly.
- Now create external tables on redshift using IAM role (which should have permissions to access s3, glue services) as we will create and access redshift tables using glue catalog.
create external schema <Redshift schema name>
from data catalog
database ‘<glue catalog DB name>’
region ‘us-east-1’
iam_role ‘<iam role arn>’;
from data catalog
database ‘<glue catalog DB name>’
region ‘us-east-1’
iam_role ‘<iam role arn>’;
Note: Creating external schemas or tables on redshift, is nothing but we are using Redshift spectrum features, so we will be billed based on spectrum charges (usually based on a scanned query)
Thank you for your time.
Comments
Post a Comment